In early June (2019) Gold broke out of a descending wedge and quickly moved higher.
Then, in July, it set up what looked to be a large bull flag – or as Peter Brandt thinks, a “half-mast” flag.
On July 18th, price broke out of the half mast flag and closed the day above it, capping one of the strongest one-day moves in that market over the last year.
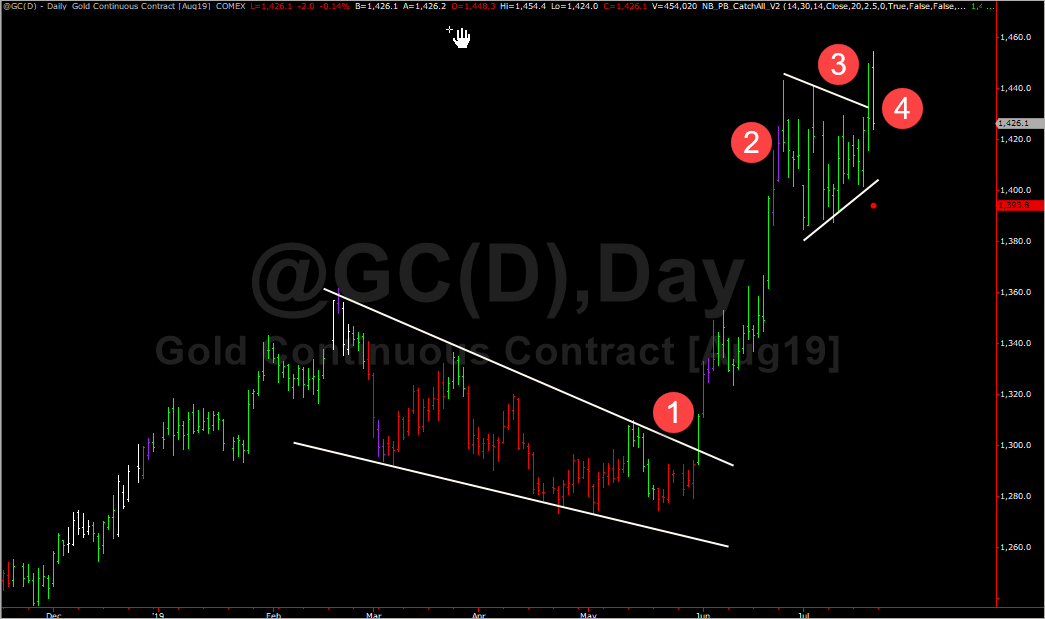
In the chart above I have marked off:
- The initial breakout from the wedge at point 1.
- Point 2 is the formation of the bull-flag / triangle / half-mast.
- Point 3 is the initial breakout from that flag.
- Point 4 is what looks like the FAILURE of that breakout – which means we’re forced to re-draw the trend-lines on the bull-flag consolidation.
When you’re forced to re-draw trend-lines, it usually means that chart is undergoing some sort of morphing and, in this case, experience suggests that this might be an extended period of morphing with lots of false breakouts.
Here are two ways that we might re-draw the trend-lines for this flag:
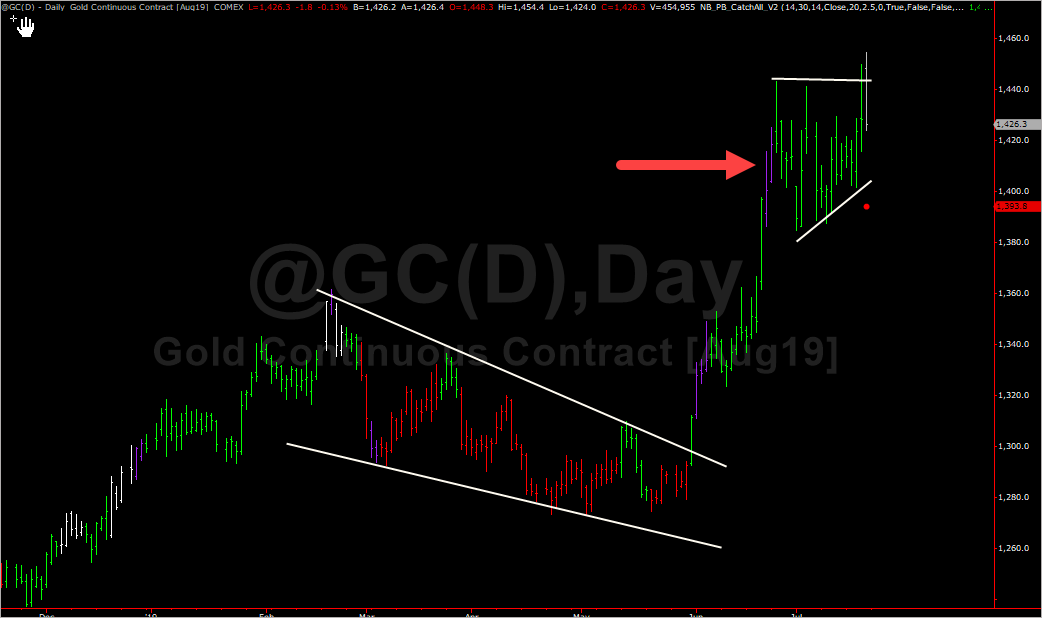
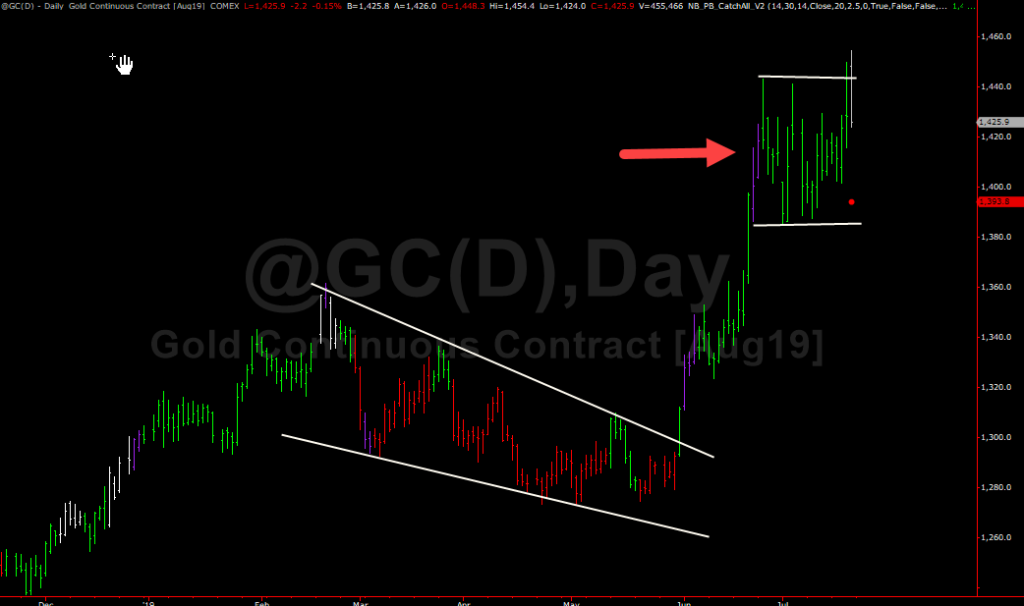
In both cases, for the gold trend to continue higher, price now has to close above the out-of-line movement created on Friday, July 19th 2019.
Everyone who bought early on July 19th or in the afternoon on July 18th is now underwater in this position. So there’s a good chance that pries goes back below 1400 to test the lower boundary of the flag. Why? Because everyone that’s now underwater in their position is likely to bail out which causes selling pressure.
Ain’t trading lovely?
Follow Me!