After breaking down back into their prior range and selling off furiously for two and a half days, the equity markets came roaring back today. They all seemed to have hit a “pocket” area where support is generally expected to show up.
With all equities deeply oversold, will there by any downside resumption or will folks hold into the weekend?
Some other markets look just like the equities – in particular CRUDE and the Canadian dollar.
Commentary
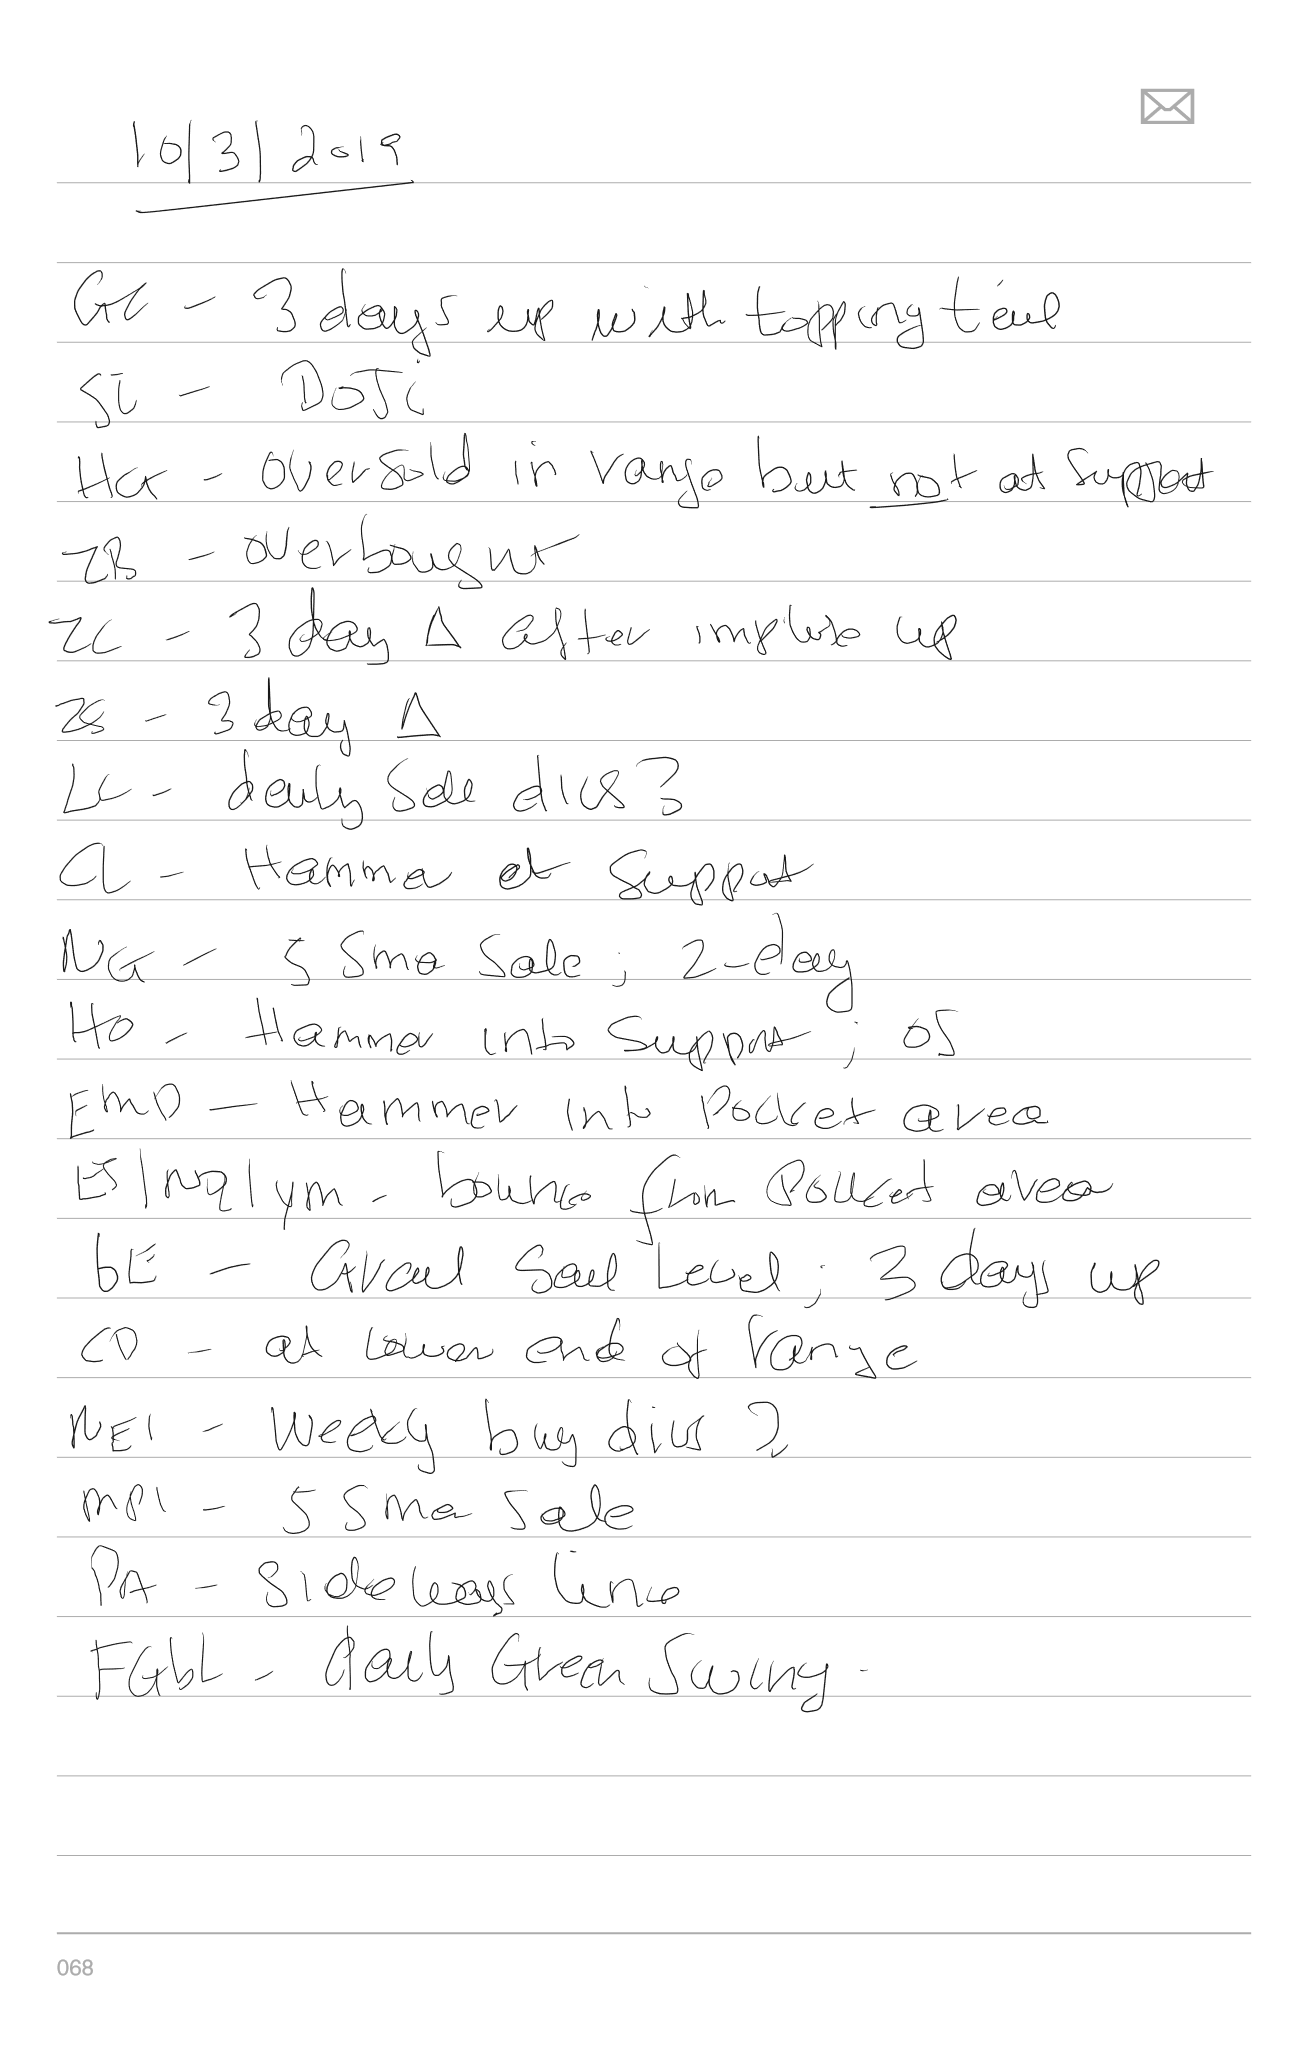
- GC: Three days up with a topping tail
- SI: Doji candlestick pattern
- HG: Oversold inside of a range but not at a support area yet.
- ZB: Overbought
- ZC: 3 day triangle after impulse up.
- ZS: 3 day triangle.
- LC: Daily sell divergences?
- CL: Hammer candlestick into a support area.
- NG: 5 SMA Sale, z-day
- HO: Hammer into support. Oversold.
- EMD: Hammer into pocket area/support.
- ES/NQ/YM: Same
- 6E: Grail sale level hit after 3 days up.
- CD: At lower end of range – looks just like US Equities.
- NE1: Weekly buy divergences?
- MP1: 5 SMA Sale
- PA: Sideways line – positive consolidation. Buy flushes for scalps.
- FGBL: First daily green swing.
Follow Me!
Posted in Homework