Yesterday (Wednesday) was another volatile day in the financial markets. Equities gave back all gains from Tuesday and then went even lower. Bonds made new all time highs (interest rates at all time lows) and seem poised for further gains after working off divergences.
I’m still suspicious of this sell off – the pattern over the last week has been more of what I call “rail-road” tracks – one day green, another day red but overall going nowhere, albeit in a very large going-nowhere range.
Commentary
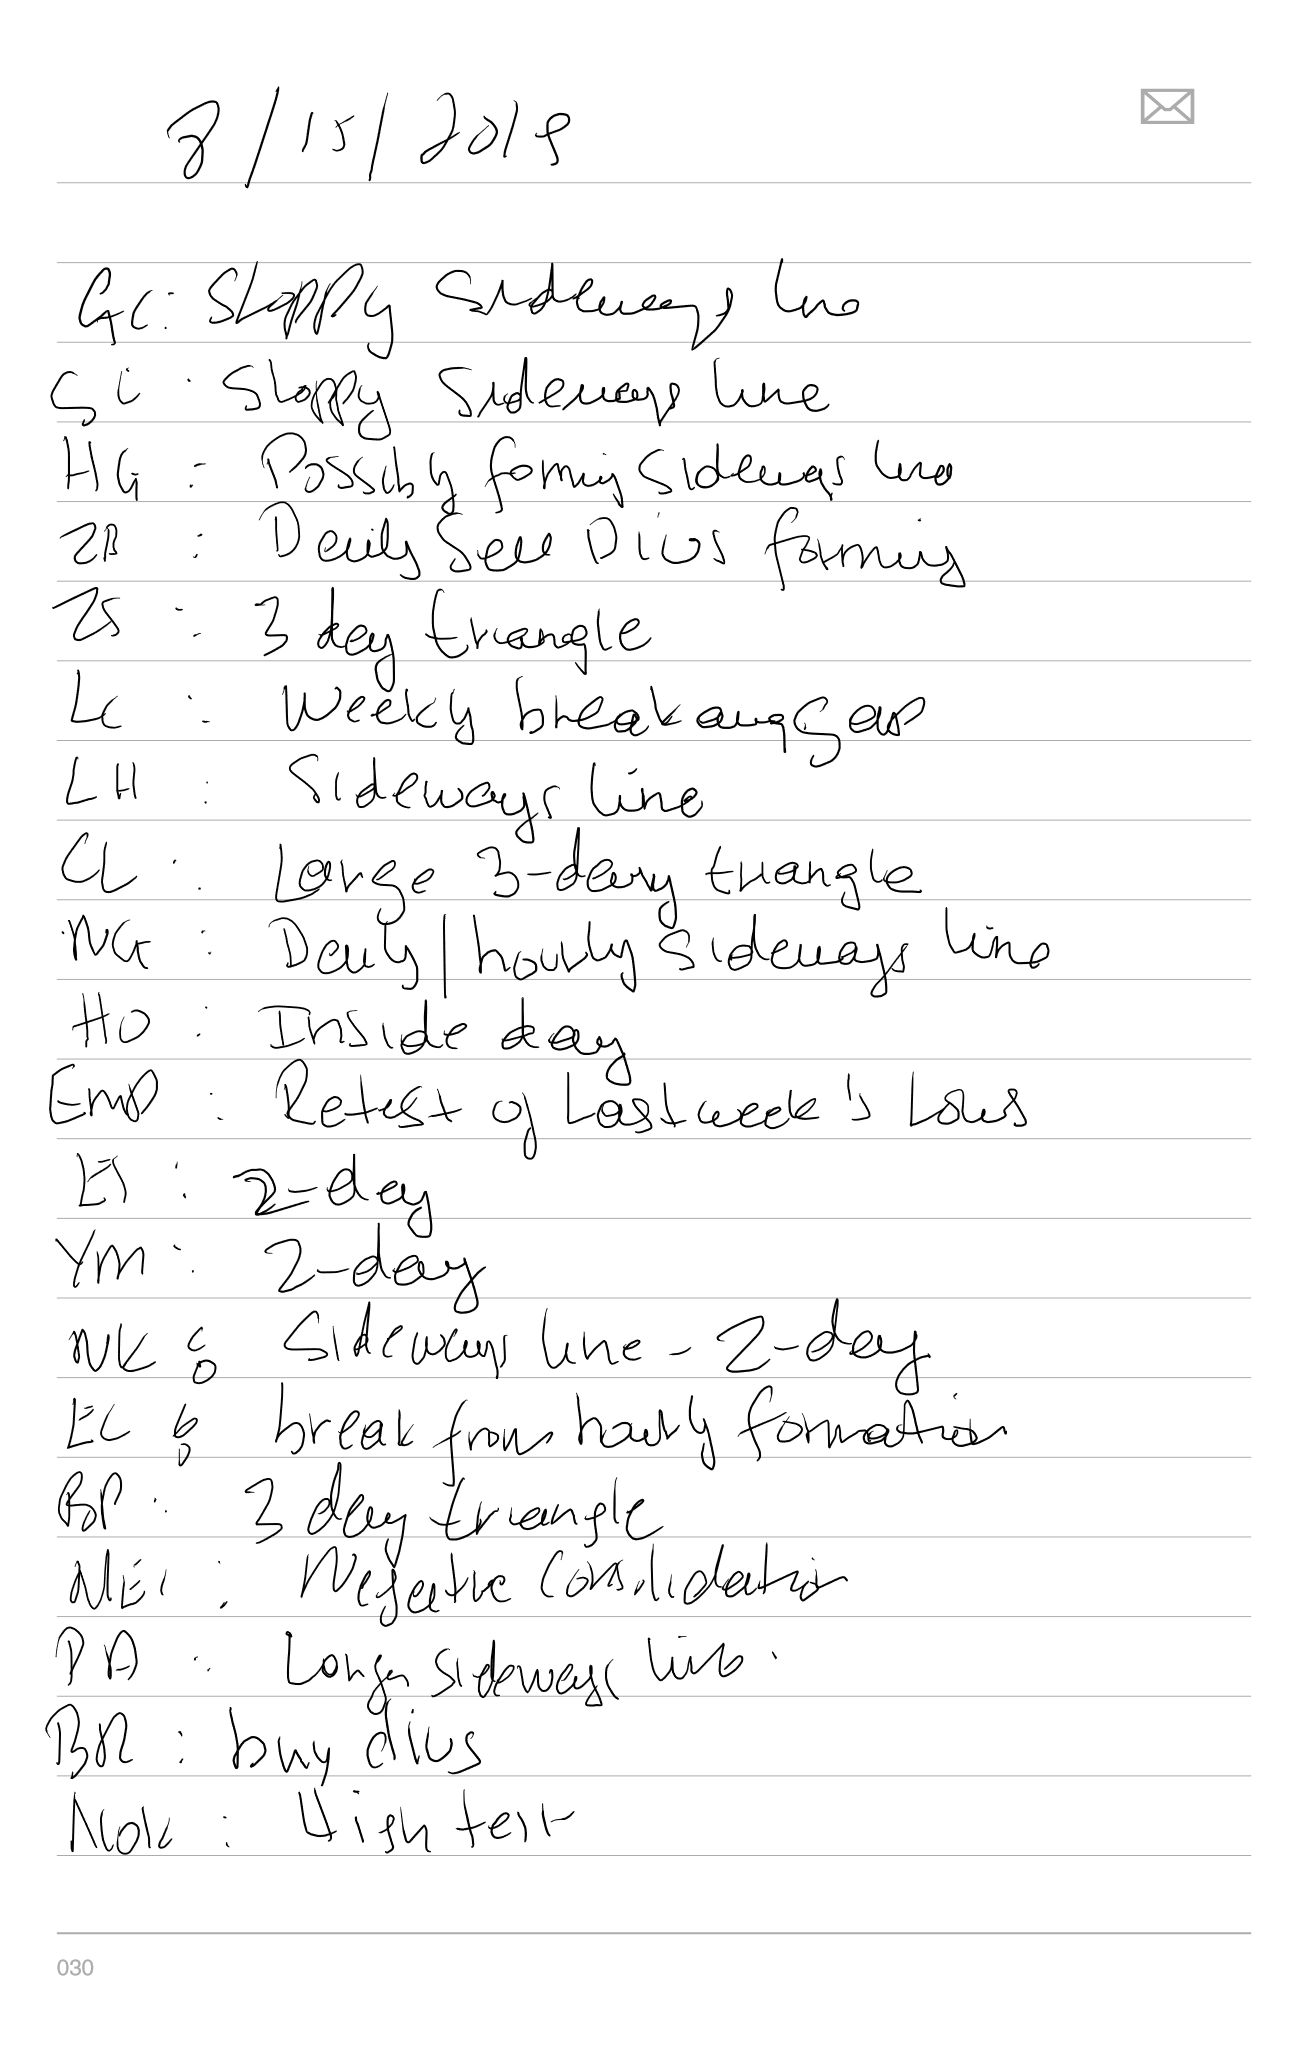
- GC: Sloppy sideways line forming
- SI: Also a sloppy sideways line forming
- HG: Possibly forming sideways line
- ZB: Forming sell divergences – maybe one or two more days up will create a better formation.
- ZS: 3-day triangle
- LC: Weekly breakaway gap – Looks like a lot more down-side after 2 limit-down days. Short bounces.
- LH: Sideways line
- CL: Very large 3-day triangle. This might just lead to a more pronounced noisy sideways line.
- NG: Hourly channel
- HO: Inside day – albeit a very large one.
- EMD: Retesting last week’s lows.
- ES/NQ/YM/FDAX/FESX/NK: All retesting last weeks lows or about to retest it. All have z-days as well. ES is closing with hourly buy divergences.
- EC: Small breakdown from hourly sideways line. Surprised this didn’t completely fall out of bed.
- BP: 3-day triangle
- NE1: Negative consolidation. Has been looking like buy divs for a few days now but so far going nowhere.
- PA: Forming a bigger sideways line after giving back gains from yesterday’s breakout.
- BR: Buy divergences
- NOK: Test prior pivot. If in this market, take half of the position off now. Z-day.
- BR: Interesting market – looks like a breakdown but has buy divergences forming and a z-day.
Follow Me!
Posted in Homework