Yesterday (Tuesday) most stock indexes continued to form sideways lines with most making a large move to the upper end of the line.
Correspondingly, other markets made similar large moves (all news related of course). Yen in particular, made a giant flush back to its daily EMA. Yesterday that market sported sell divergences – when these work, they really work!
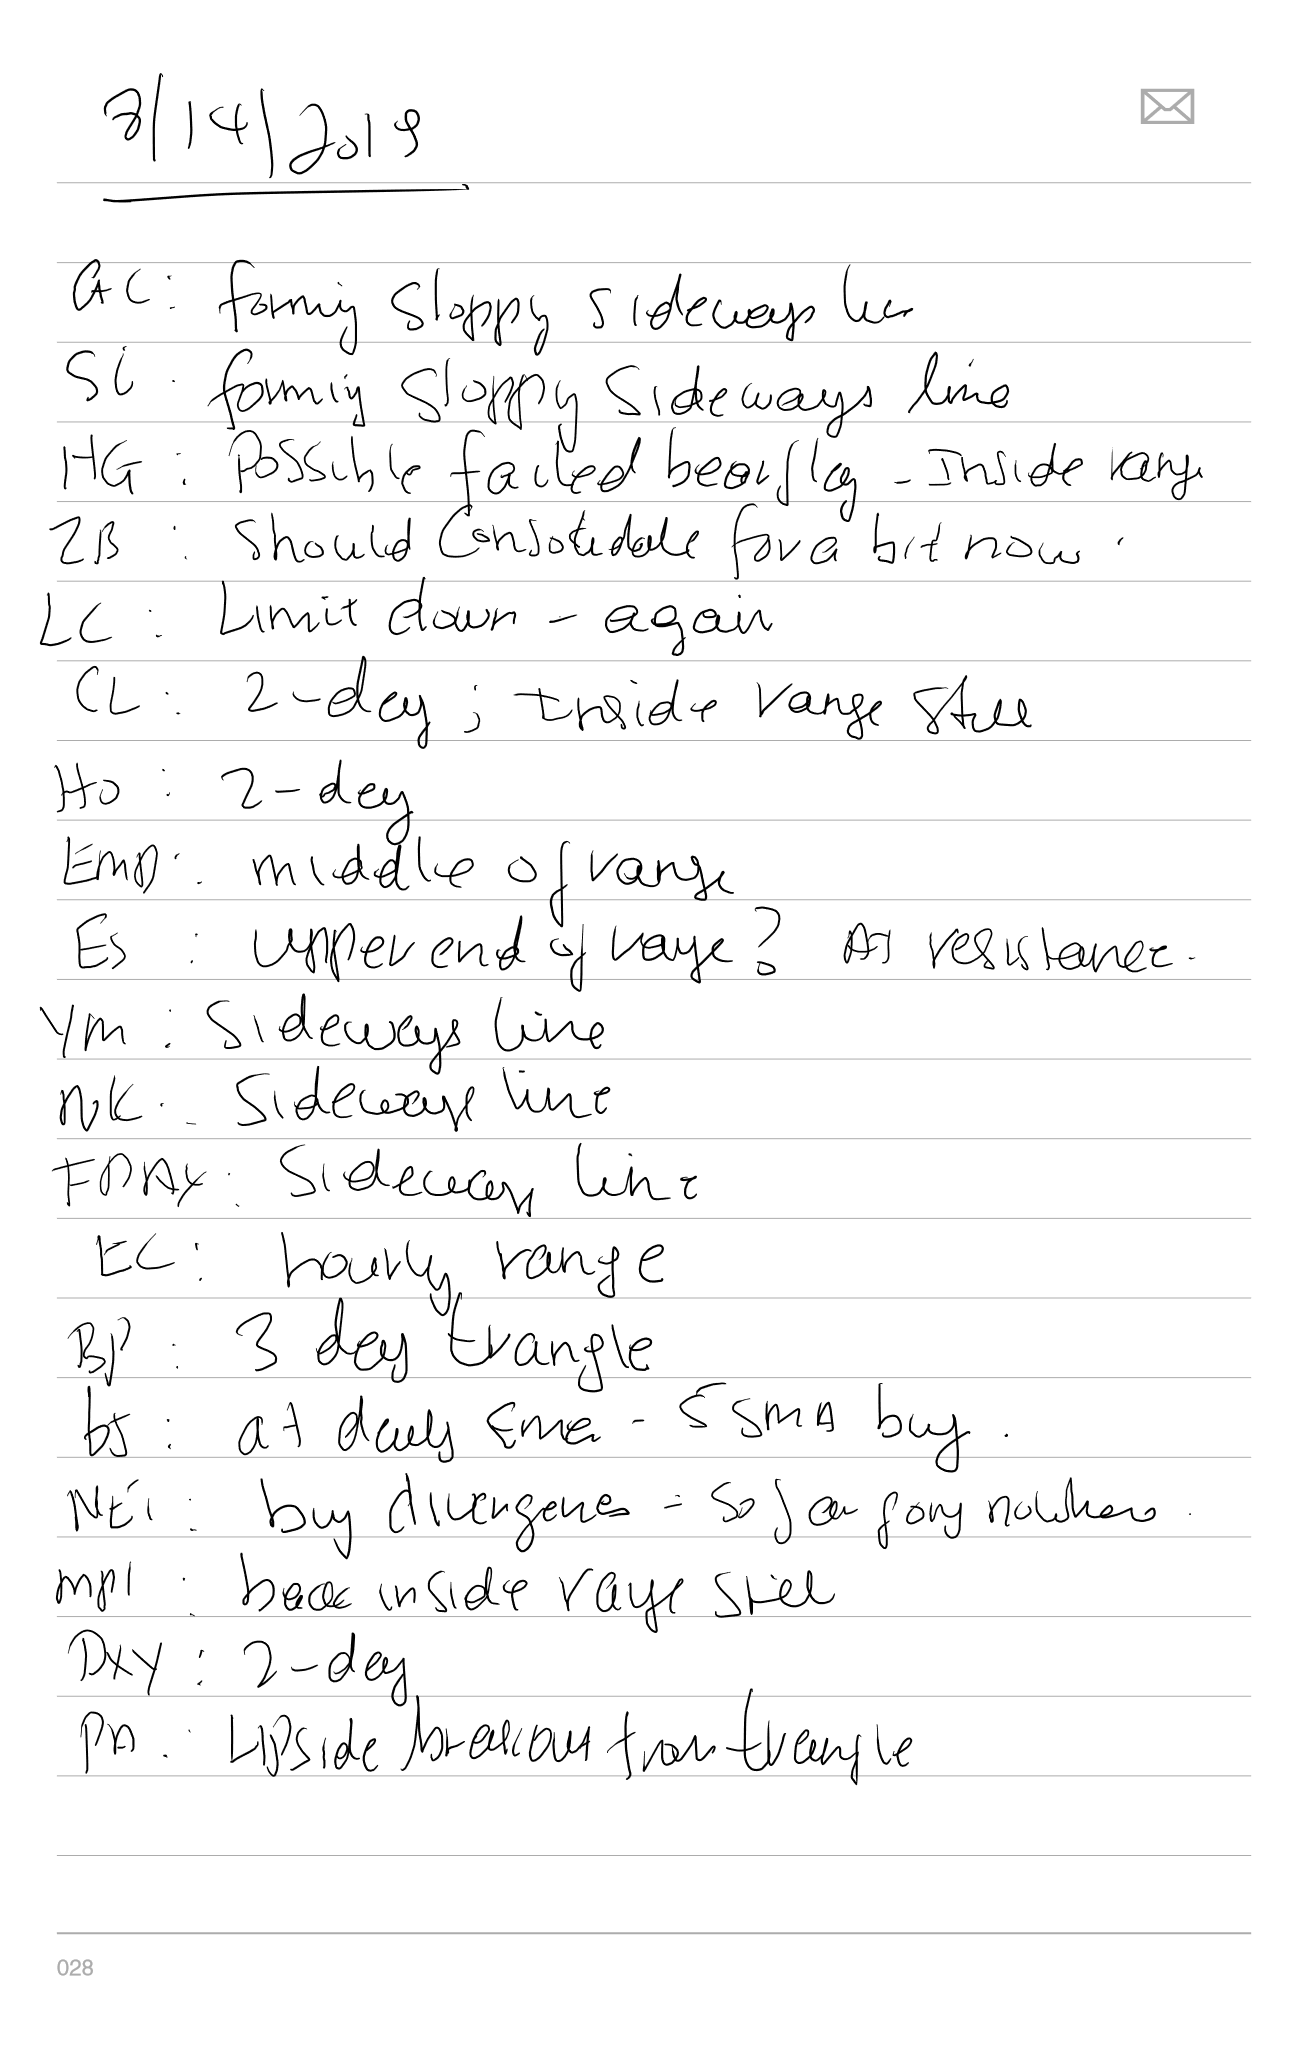
Commentary
- GC: Spike up and spike down now means we have a sloppy sideways line forming on the daily charts
- SI: Same thing as gold.
- HG: Possibly failed bear flag – this market is now firmly back inside its range with a failed breakdown on the charts.
- ZB: This should consolidate for a week or two now. Large flushes are probably buys.
- LC: Another limit down day. What a trap.
- CL: z-day – still inside its giant range.
- HO: z-day
- ES: Upper end of range – any further move up is probably a shorting opportunity.
- YM/NK/EMD/FDAX/FESX: All forming sideways lines below all-time highs
- EC: Hourly range – closed yetserday at the low of the range.
- BP: 3 day triangle. This market is crowded with shorts so would not be surprised to see an upside breakout from this.
- 6J: 5 SMA Buy (lol); at daily ema; z-day. Back inside range.
- NE1: Buy divergences on daily charts seem to be going nowhere so far.
- DX: z-day
- PA: Upside breakout from daily triangle. Surprised this didn’t paint a larger bar on Tuesday. But it did close on its highs unlike silver. Might be good for additional long trades.
Follow Me!
Posted in Homework