TSLA – this is a stock everyone seems to have an opinion on – usually extremely bullish or extremely bearish.
For example, I know at least one fund manager who is amazing in his ability to examine a company’s balance sheet and operations – he is convinced that TSLA is a fraud and has bet big against it with puts.
Yet, another good stock analyst is convinced that TSLA has a HUGE opportunity precisely because everyone is focused on the negative and is missing TSLA’s ultimate game plan.
I have no current position in TSLA but the charts are very intriguing. So lets take a look at what I see there, starting from the top:
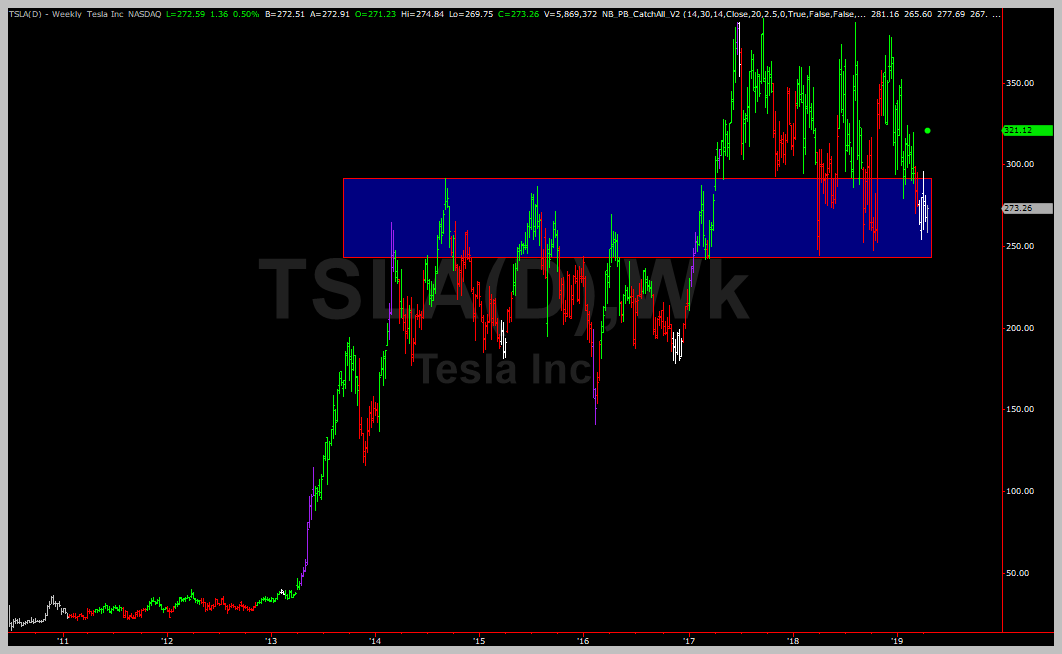
Weekly Charts: Giant Range
TSLA is at the bottom of a giant weekly range:
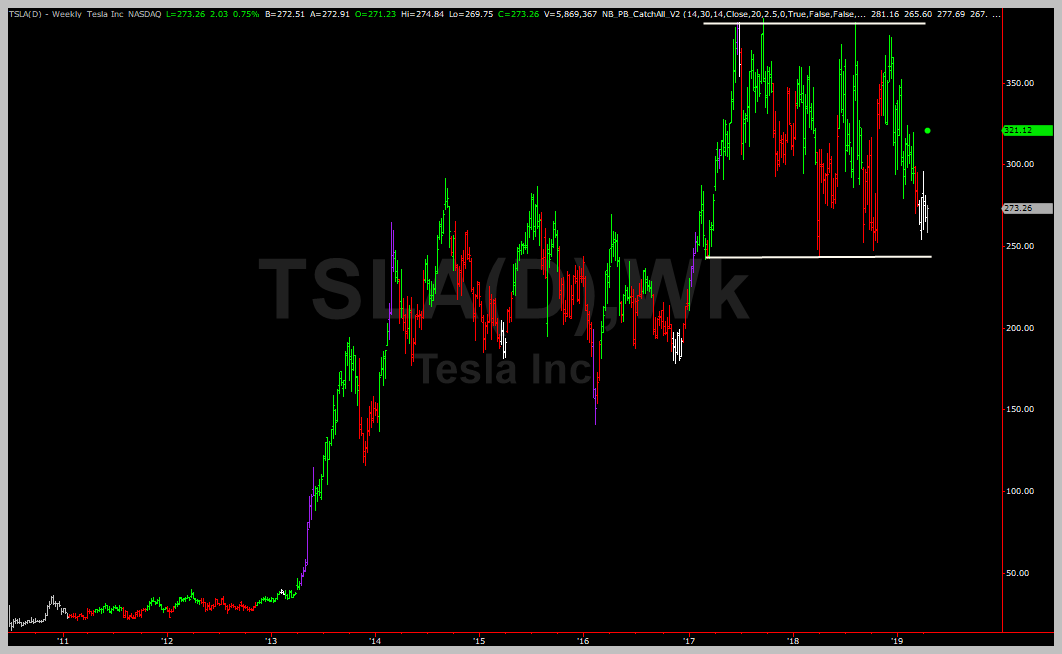
And is sitting in an area of weekly support:
For those of you reading this, you might be wondering “why is that support”? Here is a brief explanation…
Take a look at the chart marked up below with points 1, 2 and 3.
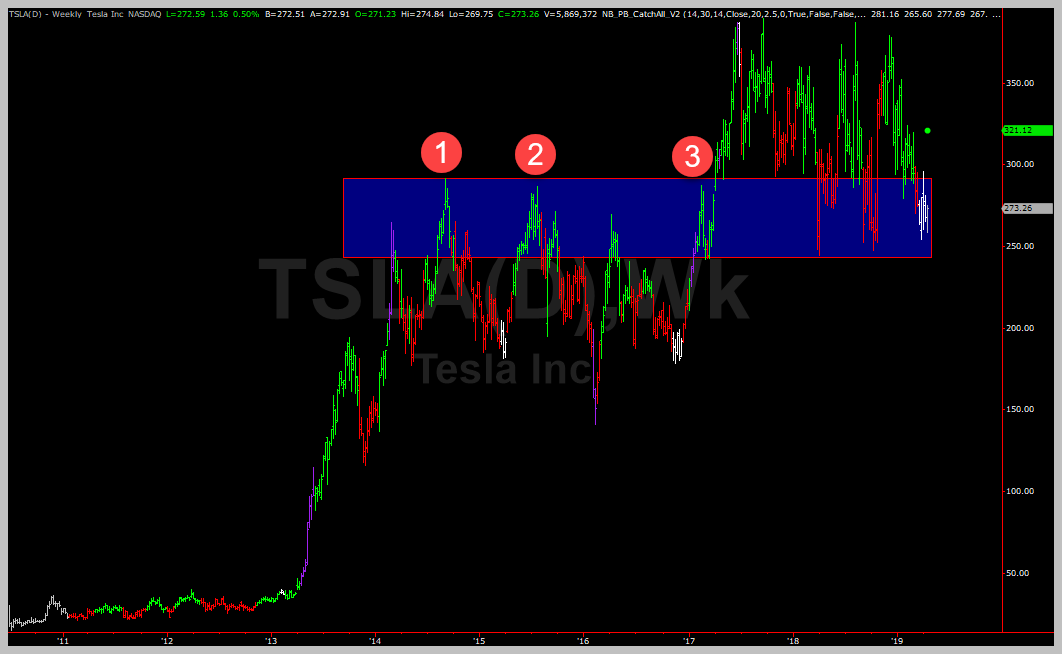
At point 1, price rallied to a particular level and fell back. At point 2, it did it again. And at point 3 it did it again. That basically suggested that the price level was significant for reasons unknown. But, shortly after point 3, price broke through that level. and stayed above it for a few months.
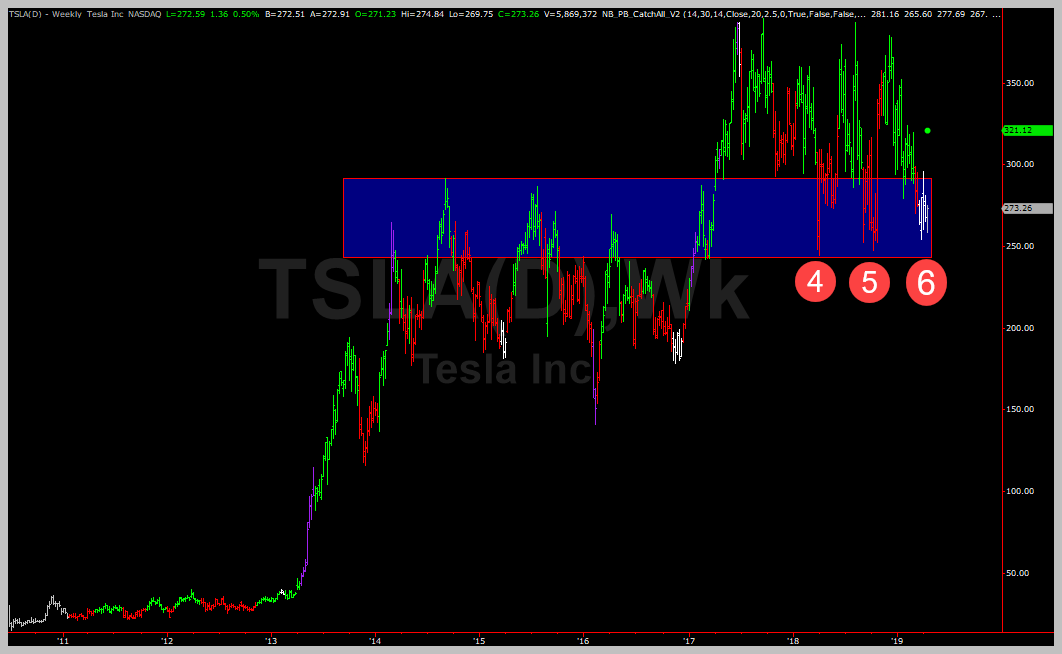
Then, price fell back to area 4, which just happened to be close to areas 1, 2, and 3. This established the first evidence that areas 1,2 and 3 were now going to be “support” – an area of price where you can expect rallies to continually take place.
And that is exactly what happened at point 5.
Point 6 is where we are now. So normally we can expect price to rally from here.
But nothing is a given. So lets drill down to a lower time-frame and take a look at the daily charts so see if we can find a clue there.
Daily Chart: Descending Wedge and Converging Trend-lines
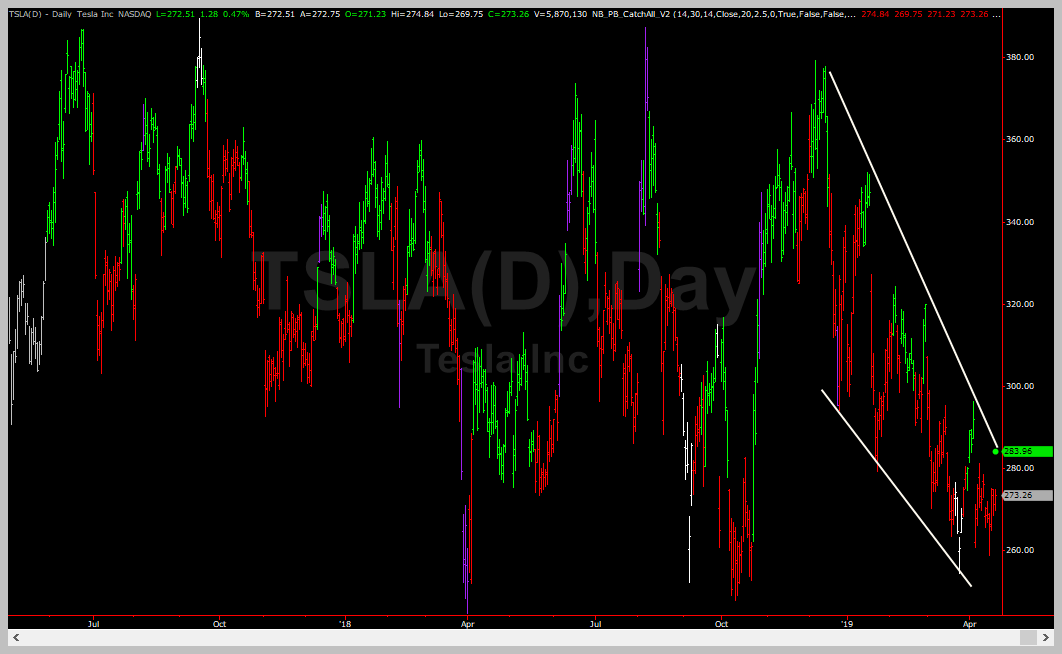
The daily chart sports a descending channel or, because the lines are pointing slightly towards each other, a descending wedge.
A descending wedge or any other area where “parallel” trend lines converge toward each other generally feature explosive moves. Based on the weekly chart we would expect that the move would break upwards out of the wedge but, again, that is not guaranteed.
The Trade
OK, Nigel – What am I supposed to with this stock then? Buy it? Sell it? Your charts are completely useless!!!!
For the amateur trader, that would be their reaction to all the charts shown above. The PRUDENT thing to do now is to wait and let the stock tip its hand – wait to see which way price breaks.
Wait, what? But I wanna trade right now!!!! Says the uber bullish and uber bearish traders.
Sorry but the prudent thing to do at this point is to WAIT.
What should you wait for?
Well, I would be waiting for a break and a price close above the upper descending trend line on the daily chart. So a close above $284 or so. At that point I would go long and put a protective STOP around $280 or so.
What if price breaks lower?
If price breaks and closes BELOW $250 I would be tempted to go short and place a protective stop above $250.
Potential Trade Summary:
Long Trade: Wait for price to close above $284. Buy and place a protective stop below $280. Target: Above $350 at the top of the weekly range but if it starts to move, definitely take a piece off, pull stop to break even and let the rest ride to $350.
Short Trade: Wait for price to close below $250. Sell-short and place a protective stop above $284. Target: Below $200 which is close to the bottom of the 2016 weekly range (not shown on the charts). If price starts to move towards that point, be aggressive about exiting pieces of your position on the way there and then moving your stop to break-even asap.
Disclosure: No position in TSLA at the time of publication.
Follow Me!